What zabbix monitors:
– Hardware Devices
– Network statistics
– Temperature, diagnostics templates
– Files metric
– Logs
– SLA
– Custom templates
– Dashboards for specific view
Table of Contents
Modules of zabbix
https://www.zabbix.com/documentation/current/en/manual/config/items/itemtypes/zabbix_agent
                          Server Zabbix ------------ Agents
                        /       |
	               /        |
                      /         |
                  Proxy    WEB(Frontend)  Database

- Server Zabbix base on Linux
- Web - PHP
- Database - Mysql or any other type of database
- Proxy

Requiments double by cpu and ram:
- 500 devices -> 2 CPU & 2 GB RAM
- 1000 devices -> 4CPU & 4 GB RAM
Zabbix Analyse Methods of Monitoring
| Type | Advantage | Disvantage | Usage |
| Zabbix Agent | Low resource usage of host | Potenatial failure of service | Most used OS like Linux and Windows |
| Zabbix Proxy | Low resource usage on Server of Zabbix | In case of failure we lose tracking of monitoring big part of hosts. Require zabbix Agent In case of installation Proxy on server needs to open new port | Machine with OS of Linux and WIndows Devices which support SNMP |
| SNMP | Native technology of monitoring ( which is not used any additional plugins) | Complicated structure for begginer | Network Devices Servers with SNMP working |
| Java Gateway | Monitoring application JMX | Support ony application JMX | Application JMX |
| Interface IPMI | Monitoring devices which support IPMI | Limited Support | IPMI devices |
Zabbix Web Interface
Zabbix Login Web interface

Zabbix Web Interface – Dashboard
- Monitoring View
- Dasbhoard (Screens before, we can build dashboard with widgets)
- Problems – where we see problems in more advance mode
- Hosts – List of Machines, VPS etc with status, Latest Data, Problems, Graphs etc
- Latest Data – Infor about EVerything but Last value and last check
- Maps – View mode wheere we can create topologies and graphical view to present
- Discovery – Status of discovery
Zabbix Web interface – Services
please refer to this link: https://www.zabbix.com/documentation/current/en/manual/it_services
Zabbix Web interface – Inventory
The Inventory menu features sections providing an overview of host inventory data by a chosen parameter as well as the ability to view host inventory details.
Zabbix Web interface – Reports
The Reports menu features several sections that contain a variety of predefined and user-customizable reports focused on displaying an overview of such parameters as system information, triggers and gathered data.
In Reports → System information a summary of key Zabbix server and system data is displayed.
Note that in a high availability setup, it is possible to redirect the system information source (server instance) by editing the ui/conf/zabbix.conf.php file – uncomment and set $ZBX_SERVER, $ZBX_SERVER_PORT to a server other than the one shown active.
With the high availability setup enabled, a separate block is displayed below the system stats with details of high availability nodes. This block is visible to Zabbix Super Admin users only.

In the Reports → Scheduled reports users with sufficient permissions can configure scheduled generation of PDF versions of the dashboards, which will be sent by email to specified recipients.

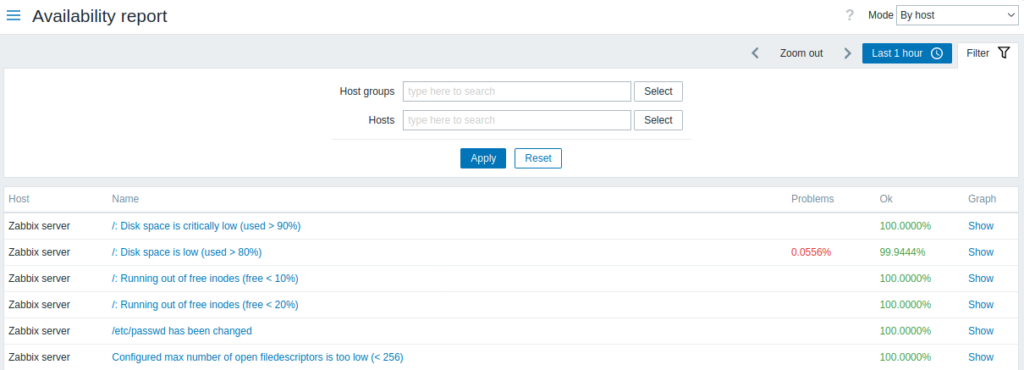
In Reports → Availability report you can see what proportion of time each trigger has been in problem/ok state. The percentage of time for each state is displayed.
Thus it is easy to determine the availability situation of various elements on your system.
In Reports → Triggers top 100 you can see the triggers that have changed their state most often within the period of evaluation, sorted by the number of status changes.

In the Reports → Audit section users can view records of changes made in the frontend.

In the Reports → Audit section users can view records of changes made in the frontend.
Audit logging should be enabled in the Administration settings to display audit records. If logging is disabled, history of frontend changes does not get recorded to the database and audit records cannot be viewed.
In the Reports → Notifications section a report on the number of notifications sent to each user is displayed.
From the dropdowns in the top right-hand corner you can choose the media type (or all), period (data for each day/week/month/year) and year for the notifications sent.

Zabbix Web Interface – Configurations
In the Configuration → Templates groups section users can configure and maintain template groups.
A listing of existing template groups with their details is displayed. You can search and filter template groups by name.

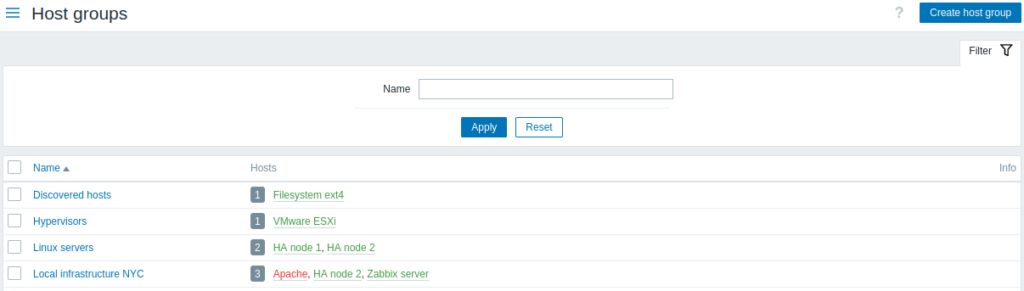
In the Configuration → Host groups section users can configure and maintain host groups.
A listing of existing host groups with their details is displayed. You can search and filter host groups by name.
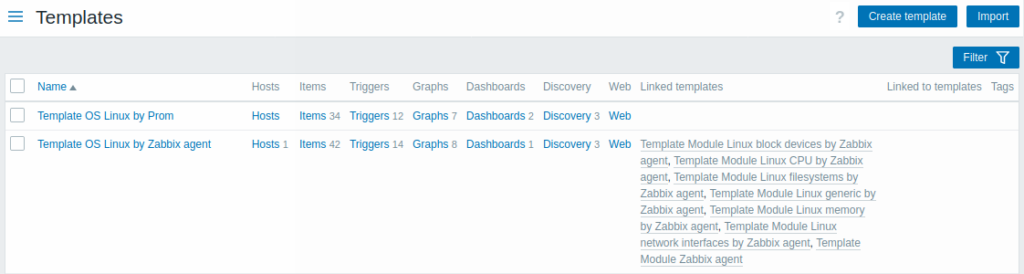
In the Configuration → Templates section users can configure and maintain templates.
A listing of existing templates with their details is displayed.
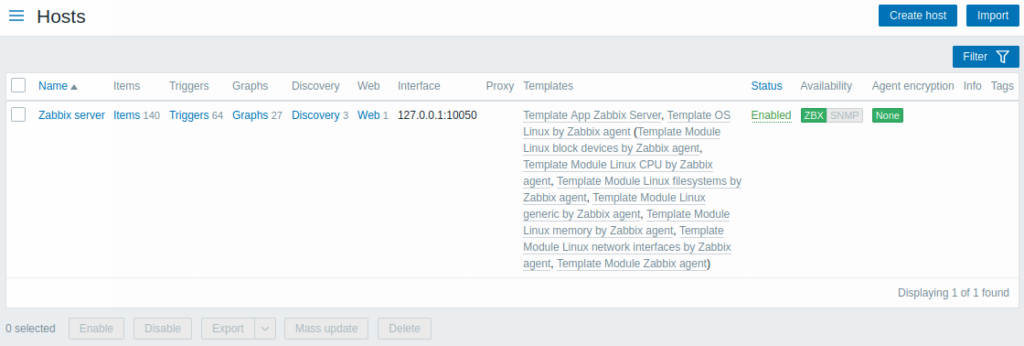
In the Configuration → Hosts section users can configure and maintain hosts.
A listing of existing hosts with their details is displayed.
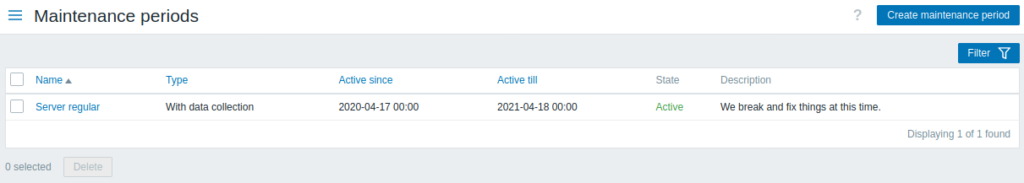
n the Configuration → Maintenance section users can configure and maintain maintenance periods for hosts.
A listing of existing maintenance periods with their details is displayed.
In the Configuration → Actions section users can configure and maintain actions.
The actions displayed are actions assigned to the selected event source (trigger, discovery, autoregistration, internal actions).
Actions are grouped into subsections by event source (trigger, service, discovery, autoregistration, internal actions). The list of available subsections appears upon pressing on Actions in the Configuration menu section. It is also possible to switch between subsections by using a title dropdown in the top left corner.
After selecting a subsection, a page with a list of existing actions with their details will be displayed.
For users without Super admin rights actions are displayed according to permission settings. That means in some cases a user without Super admin rights isn’t able to view the complete action list because of certain permission restrictions. An action is displayed to the user without Super admin rights if the following conditions are fulfilled:
- The user has read-write access to host groups, hosts, templates, and triggers in action conditions
- The user has read-write access to host groups, hosts, and templates in action operations, recovery operations, and update operations
- The user has read access to user groups and users in action operations, recovery operations, and update operations

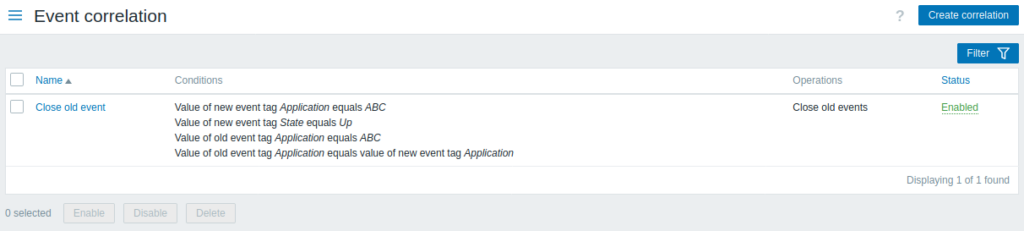
In the Configuration → Event correlation section users can configure and maintain global correlation rules for Zabbix events.
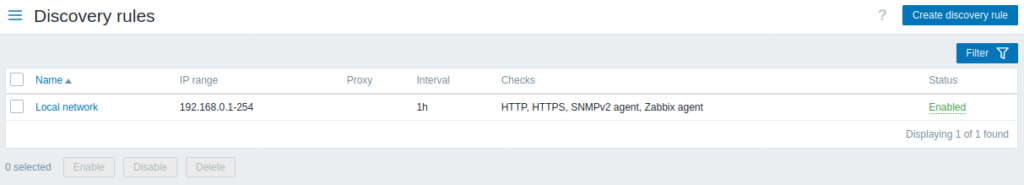
In the Configuration → Discovery section users can configure and maintain discovery rules.
A listing of existing discovery rules with their details is displayed.
Zabbix Web Interface – Administration
Zabbix Templates
Zabbix Installation Server Part
https://www.zabbix.com/download?zabbix=6.0
*please enable hostname it's important for SElinux

1) Add repository
2) install zabbix-server-mysql zabbix-web-mysql zabbix-apache-conf zabbix-sql-scripts zabbix-agent

install mysql-server

3) Create Initial Database
# mysql -uroot -p

password
mysql> create database zabbix character set utf8mb4 collate utf8mb4_bin;
mysql> create user zabbix@localhost identified by 'password';
mysql> grant all privileges on zabbix.* to zabbix@localhost;
mysql> quit;


4) On Zabbix server host import initial schema and data. You will be prompted to enter your newly created password.
zcat /usr/share/zabbix-sql-scripts/mysql/server.sql.gz | mysql --default-character-set=utf8mb4 -uzabbix -p zabbix
5) Edit file /etc/zabbix/zabbix_server.conf
DBPassword=password


#enable services to start at boot
systemctl enable mysql
systemctl enable zabbix-server.service
systemctl enable [webserver]
Server configuration
z#edit file /etc/zabbix/zabbix_server.conf

1) Enable DBHost=[ip/domain]
2) Enable DBUuser=zabbix
3) Enable DBPassword=[passowrd]

#edit file /etc/php.ini *it may vary on certain distro
#edit file /etc/php/[version]/[web_server]/php.ini

#uncomment all edited - remove ;

#To make sure you have the same time as application
data.timezone = Europe/Warsaw | Europe/Luxembourg

#Limit of time for process of PHP. It will stop exectution of script
max_execution_time = 600

#Param responsable for how fast application needs to send file to the server
max_input_time = 600

#Param responable for limit memory usage for PHP application
memory_limit = 256M

#POST METHOD, this param needs ot be bigger than upload_max_filesize
post_max_size = 16M

#Param for file size which is send to the server
upload_max_filesize= 8M

#Restart web server
Selinux * Only Centos, Alma, RedHat, cloudlinuix
#check if Selinux is enable
sestatus

#disable selinux
setenforce 0

#enable selinux
setenforce 1

setsebool -P httpd_can_network_connect on
setsebool -P zabbix_can_network on

#install packages for policy
dnf install policycoreutils checkpolicy setroubleshoot-server

#restart zabbix
systemctl restart zabbix-server zabbix-agent httpd php-fpm


#if zabbix restart is not working please check journal

journalctl -xe


#you will need ot check message and allow methods
ausearch -c 'zabbix_server' --raw | audti2allow -M my-zabbixserver
semodule -X 300 -i my-zabbixserver
#** be patient !!! it takes a while.

#restart or start zabbix-serveer.service
systemctl start zabbix-server.service
Firewall
#centos, redhat, almalinux, cloudlinux
firewall-cmd --add-service={http,https} --permanent

firewall-cmd --add-port={10051/tcp,10050/tcp} --permanent

#reload cmd firewall
firewall-cmd --reload
Web interface
#to enable it
[ip_or_domain]/zabbix

#example
192.168.178.11/zabbix


#After entierning zabbix web interface please CHANGE ADMIN password.

#default  web interface Admin credentials
Admin / zabbix
Problem with Installation
#Mostly permision issue zabbix.conf.php
Downlaod the config file and paste it in /etc/zabbix/zabbix.conf.php
Zabbix Agent – Information
#1 Collecting data
#2 Sending information to the server
#3 Checking Resources 24x7 HD, RAM, CPU, others

#4 It supports many OS
#5 To exchange data it use JSON protocol

Phase 1 - Collecting Data
Agent open connection TCP

Server reply with checking specific data

Agent analyze request

Connection TCP become close

Agent start collecting Data


Phase 2 - Sending Data
Agent opens connection tCP

Agent sends list with Data

Server taking care of request and sending information back

Request TCP stays close
Zabbix Agent – Windows 10
1# Downlaod zabbix agent
2# Unzip it
3# copy contetnt to specific location
4# edit file confzabbix_agentd.conf
Server=[IP_of_server]
Hostname=[hostname_of_machine]
ListenPort=[10051]
StartAgents=5
5# Install zabbix From path run this command:

binzabbix_agentd.exe -c "PATH_TO_CONFIGconfzabbix_agentd.conf" -i

6# to check it please open windows +r type:
services.msc

7# Firewall for windows
- Go To System and Security -> Windows Defender -> Enable & Disable Firewall Windwos
Deffender  ---- to disable completete !!! very bad but good for testing

Good way -> Enable application to communicate by the Firewall
Choose file path to zabbix agent binzabbix_agentd.exe

8 test with telenet [ip_of_machine] 10051
Zabbix Agent – Linux
1# Add repository to system or downlaod zabbix specific on system
https://www.zabbix.com/download?zabbix=6.2
2# systemctl enable zabbix-agent
3# systemctl start zabbix-agent
4# vi /etc/zabbix/zabbix_agent.conf
Edit EnableRemoteCommands=0
Edit Server=[IP_of_server]
Edit Hostname=[hostname_of_machine]
Edit ListenPort=[10051]
Edit StartAgent=5

5# Firewall
Firewalld - firewall-cmd --permanent --add-port=10051/tcp
Firewalld - firewall-cmd --permanent --add-port=10050/tcp
Firewalld - firewall-cmd --permanent --reload

#restart zabbix agent after each firewall change to make sure agent will work
sstemctl restart zabbix-agent
Zabbix Agent – Custom script
#edit /etc/zabbix/zabbix_agentd.conf

#add command at end of file
UserParameter=[KEY], [path_to_script

# to test it please use:
zabbix_get -s [IP of AGENT] -p [Port] -k [KEY]
#Example
zabbix_get -s 192.168.10.2 -p 10051 -k [custom_key]

#1 On Zabbix server Go to Server -> Configuration -> Host -> select Host and edit Item
#2 Select type of Zabbix agent, [Key] that's it
* Please remeber adding return value needs to modified so that zabbix trigger can work
* work with it.
#3 Triggers allow to send information to dashnboard, Stay on the Configuration -> Host
#3 Add the trigger which base on item
#3 Make sure that trigger is working propey
zabbix gitlab repository for specific scripts:
SNMP
#Year 1987 - createion of SGMP - Simple Gateway Management Protocol
It was first protocol for monitor gateway,

Snmp
Protocol has two types of devices:
 - managed
 - manageable

First type of run service call is SNMP which purpose is storage information of state
of the device

Second type contains manager SNMO which has prupose reading sending values.
*Trap send information from agent to manager  for unexpected behaviour.

MIB
Is database which each element contains value, objects are store in tree hierarchy.
To obtain specific data set it require provide specific code, Structure database MIB is
in documentation RFC 1213.

Specification contains standard database of MIB, call MIB-I, which contains ore than 100
definitions.

1) System objects
2) Interfaces
3) Translation table
4) IP
5) ICMP
6) TCP
7) UDP
8) EGP

Package	Provides
net-snmp	The SNMP Agent Daemon and documentation. This package is required for exporting performance data.
net-snmp-libs	The netsnmp library and the bundled management information bases (MIBs).
This package is required for exporting performance data.
net-snmp-utils	SNMP clients such as snmpget and snmpwalk. This package is required in
order to query a system's performance data over SNMP.
net-snmp-perl	The mib2c utility and the NetSNMP Perl module.
net-snmp-python	An SNMP client library for Python.

#install Centos

yum install net-snmp net-snmp-libs net-snmp-utils

#Extend using script
https://access.redhat.com/documentation/en-us/red_hat_enterprise_linux/6/html/deployment_guide/sect-system_monitoring_tools-net-snmp-extending
SNMP – Veraxsystems
This tool allow snmp simulation


Install SNMPD
SNMP walk
#insatll
net-smtp-utils

#example snmp v1
snmpwalk -v1 -c public [IP]

#exmaple snmp walk for snmp v2
snmpwalk -On -OU -v2c -c [password] [IP]


#SNMP v3
snmpwalk -v3 -l authPriv -u swordMaster3000 -a SHA1 -A "PASSWORD1" -x AES -X "PASSWORD2" 192.168.178.249
SNMP translate
#SNMP MIB file
snmptranslate -Tz -m [file.MIB]

snmptranslate -IR -On
SNMP v3
#install snmpd

#edit or create file /ect/snmp/snmpd.conf

#edit on which ip, protocol, should snmpd agent listen
agentAddress udp:161,udp6:[::1]:161

#copy paste this path there
#create user for v3 SHA1, ASES128 read only
net-snmp-create-v3-user -ro -A [KEY] -a SHA -X [KEY] -x AES [username]


##############################
!!! REMARK compiles condig file: /var/lib/snmp/snmpd.conf
!!! REMARK comment all rocommunity to disable v1/v2.
#################################
SNMP exten by custom Private OID, custom script
It seems that the only way to define a data type for the data is to use the more complex pass or pass-persist directives instead. An example of pass :
#Create file .sh on specific path ~ recommend /etc/snmp/custom_scripts
#!/bin/sh -f
echo .1.3.9950.1.1
echo integer
/bin/systemctl is-active [service] > /dev/null && echo 2 || echo 0


#make file executable
chmod +x [yourscript]

#edit /etc/snmp/snmpd.cond

pass .1.3.9950.1.1 [path_to_script]
#can be custom OID


#restart snmpd
systemctl restart snmpd

#verify
snmpwalk -Os -v 3 -u [USER]-l authPriv -a sha -A [KEY] -x AES -X [KEY] [IP_HOST] .1.3.9950.1
In this case the script (custom script) is given responsibility for the OID subtree .1.3.9950.1.1, which is within the private OID range . This means that the program you’ve defined is expected to be able to handle iterating over all the OID objects in that subtree (see snmpd.conf man page). In other words the script should implement a SNMP getnext function . It is possible, however, to have a pass program that returns just one static OID object. The above custom script.sh script is a trivial example of that:
Zabbix Agent check – something like snmp walk
#On server of zabbix run this command
zabbix_get -s [IP of AGENT] -p [Port] -k [KEY]
#Example
zabbix_get -s 192.168.10.2 -p 10051 -k proc.num[,mysql]
Adding Hosts to Zabbix Server – Zabbix Server side
#1 Login to web interface
#2 Go to -> Configuration -> Host Group -> Right top -> Create host group
#3 Go to -> Confiuguration -> Right top -> Create host
Input Host name

Input Templates * if needed #Templates  info bellow
Input Groups
Input Interface an type
	Agent - IP, Connect to IP or DNS, Port - same as in agent zabbix port : 10050
Input Description if needed
Select proxy if is under proxy
#4 Click Add
Zabbix Agentless
# Request accessing port TCP, repsonse time TCP, checking services
# Checking availablity, servers checkin, reponse ping time, lose packets
#Running commands over ssh and telnet

#IPMI
#Monitoring state and availibity devices with interface IPMI
#Services which support devices with Support of IPMI (HP iLO, Dell DRAC ETC)
Zabbix Proxy – jump host
- When Firewall blocks access to network or ports
- Different Localisation
- No VPN access

Advantage of Zabbix Proxy
- ProxyOfflineBuffer – Set how long service will be holding the data in case of not accessiblity of Server
- Perfomance – Proxy collect data and reduce usage of main server and reduce usage of resource of main server
- Monitoirng remote Localisation – Monitoring servers, devices which are in remote locatalization of comapny
#Installation of Zabbix Proxy
#for Centos Red Hat base system
setenforce 0 && sed -i 's/^SELINUX=.*/SELNUX=permissive/g' /etc/selinux/config
firewall-cmd --add-service={http, https} --permanent
firewall-cmd --add-port={10051/tcp,10050/tcp] --permanent
firewall-cmd --reaload

#1 Add pacakge of zabbix depending of OS
#2 clear repo on system
#3 install zabbix
zabbix-proxy-mysql
#4 mysql_secure_installation
#5 create mysql user, create permission for user, set property, run zabbix script
#6 edit file
vi /etc/zabbix/zabbix_proxy.conf
Server=[ip_of_server]
DBPassword=[password_set]
DBName=[database_name]
DBUser=[user_database]
ConfigFrequency=100

#7 Restart and enable on boot proxy
systemctl restart zabbix-proxy
system enable zabbix-proxy
#8 Login to Web interface of Zabbix Server - default Credentials
Admin / zabbix
#9 Go to  Administaration Proxies
#10 Go to Top Right -> Create proxy
#11 Choose proxy name
Zabbix Server – Dashboard Setup
#Monitoring - Contains Dashboard of Monitored items
#Reports - System Information - very useful inventory
#Configuration - contain system Information which can be edited
#Administration - Admini page for Zabbix
Zabbix Server – Items
#Adding paramaters which will collect information
Zabbix Server – Triggers
#Adding limits which will throw problem in Zabbix
Zabbix Server Dashboard – Hosts Graph View
# Go To Configuration -> Hosts -> Select Hosts - Graphs - create new graph and
Zabbix Server – Templates SNMP
# Go to Templates -> right Top -> Create Template
Template contains
- name
- optiona visible name
- groups where it belongs in terms of usage


# Then we create zabbix Item, we select specifi key which can be introduce in template
Item contains:
- Name
- Type by what it will be pull
- Key - selected from zabbix
- Type of information
- Units - metric which will be use
- Intervals - how ofent


# Base on Item we create Trigger which will invoke the problem when value is reached
Trigers contains:
- Name
- Serverity
- Expression -
Zabbix Server – Templates SNMP
Need more info how to really do it
Zabbix Server – Authentication and creating of User
#Administration -> Authentication
Internal - Server
LDAP - server
It can be plugged to Active directory or external service which manage uses


#Users
User - part
			- Alias
			- Name
			- Surname
			- Group

Media - Part where we can select what type of communication user will get while
there is a problem

Permissions - Part where we select the group user is assigned.
Zabbix Alarms
#Enable only useful items

Types of Media for Alarms
- Email
- SMS
- Communicators
- Webhooks
- Scripts

For Email notification please setup Mail Zabbix
Zabbix Alarms – Actions
Go to Configurations -> Actions
Create Actions

Setup Name

Select Conditions - when it should be send
Operations - When, to Whom (Operations)
    - Recover operations
    - Update Operations
Go to Users -> select Users -> Add Media -> Select Serverity
After that Please Save it.

Go Please to Dashoard and check Problems - Right Side Actions
Zabbix Alarms – Sending Email using Script
curl --url 'smtps://smtp.gmail.com:465' --ssl-reqd  --mail-from 'your@gmail.com'
--mail-rcpt 'username@gmail.com'  --upload-file [Path_to_script] --user 'google_account@gmail.com'


!/usr/bin/env python3
–– coding: utf-8 ––
„””
Zabbix SMTP Alert script for gmail.
„””
import sys
import smtplib
from email.mime.text import MIMEText
from email.header import Header
from email.utils import formatdate
Mail Account
MAIL_ACCOUNT = 'twojemailgmail.com’
MAIL_PASSWORD = 'twojehaslo’
Sender Name
SENDER_NAME = u’Zabbix Alert’
Mail Server
SMTP_SERVER = 'smtp.gmail.com’
SMTP_PORT = 587
TLS
SMTP_TLS = True
def send_mail(recipient, subject, body, encoding=’utf-8′):
session = None
msg = MIMEText(body, 'plain’, encoding)
msg[’Subject’] = Header(subject, encoding)
msg[’From’] = Header(SENDER_NAME, encoding)
msg[’To’] = recipient
msg[’Date’] = formatdate()
try:
session = smtplib.SMTP(SMTP_SERVER, SMTP_PORT)
if SMTP_TLS:
session.ehlo()
session.starttls()
session.ehlo()
session.login(MAIL_ACCOUNT, MAIL_PASSWORD)
session.sendmail(MAIL_ACCOUNT, recipient, msg.as_string())
except Exception as e:
raise e
finally:
# close session
if session:
session.quit()
if name == ’main’:
„””
recipient = sys.argv[1]
subject = sys.argv[2]
body = sys.argv[3]
„””
if len(sys.argv) == 4:
send_mail(
recipient=sys.argv[1],
subject=sys.argv[2],
body=sys.argv[3])
else:
print(u’requires 3 parameters (recipient, subject, body) t$ zabbix-gmail.sh recipient subject body’)
Zabbix Alarms – Telegram
#Create Telegram account
https://web.telegram.org/#/im

#Serach for BotFather

#Type command:
/start

/newboot
#both will ask you for the bot name
[bot_name]_bot
#Copy the HTTP API token:


#later find
@myidbo, bot (IDBot)
/start

#In IDBot type this command and save output:
/getid

#Search for your bot and type:
/start


#Since version 6.0 telegram is included if not you can import it :
https://git.zabbix.com/projects/ZBX/repos/zabbix/browse/templates/media/telegram/media_telegram.xml?at=release/4.4


#Go To Zabbix Server -> Administration -> Media types -> Telegram
#copy paster token and

#Go Back to previos tab and run test
#Make sure that there is token from API of telegram
#To id of bot which we pulled before.
Zabbix Reports – Tips for new people
System Informations:
- Check what is running if all is okay etc.
Availability report
- How often there are a problems
Triggers top 100
- Which trigger are lunched the most of time
Audit
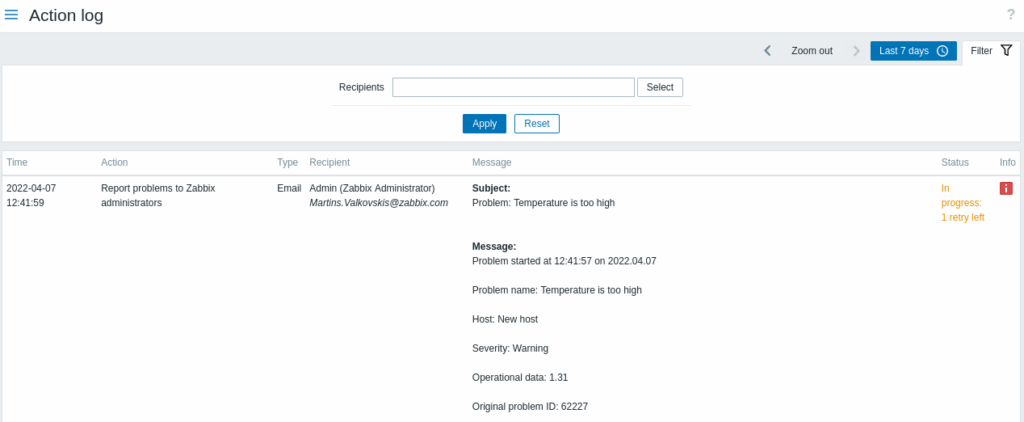
Action log
- errors and system zabbix logs
Notifications
Import and Export
You can just export Template or Host configuration and edit it via XML file and upload
again.
Main key is that is faster but requires knowledge of XML.
THere is multiple Agent:
- Zabbix Agent
- SNMP agent
- Agentless - Simple check
-
Zabbix – Templates and Discovery
1) Download Templates  vs selfmade
2) Server monitoring, Virutal and Bare metal Windows Linux, Dedicated machine IPMI
3) Using SNMP monitor switch, router, (netowrking usage, availablity, bandwith)
Zabbix – Templates and Discovery – Discovery
#Module is to discover and add to inventory
#Discovery is responsable to add hosts to Inventory, Network devices, components
#Can be very dangerous when use in very bad way to allow to scan add everything
#This can start show a lot of problems with triggers which we do not need
#Please review Zabbix monitoring time to time to check if there is not a lot things
#enabled
Zabbix – Templates and Discovery – Automate adding Triggers
1) Go to Configuration -> Template -> Craete Template
2)Choose name of Template
3) Add groups, please select templates
4) Add template
4) Go Back to template and selected templated which you created
5) Chose Discovery for the Template you have recently create
6) Example of createion of Discovery rule for ntework interfaces
6.1) Select Name
6.2)Type - agent zabbix
6.3) Key = net.if.discovery
6.4) Update Interval = 1m || 5s
6.5) Add Discovery rule
7) Discovery needs item protopyte otherwise Disvoery is not sued
7.1) Select items prototypes
7.2) Slect name for the Item prototype
7.3) type zabbix agent
7.4) Key = net.if.in(#IFNAME)
* It checks for networking in traffic
** #IFNAME - means network intreface
7.5) Units - Select Bps
7.6) Update interval = 5s | 1m
8) Create Trigger protoptyes for that Discovery
8.1) Select name
8.2) select severity
8.3) Expression
8.3.1) Select Item from previous item creation
8.3.2) Result bigger than -> 6000
9) Generate Graph
9.1) Select item -> previous created template with Discovery and items
10)
Zabbix – Templates and Discovery – Monitor unwanted devices
1) Go to Configuration -> Discovery
2) Create Discovery
3) Create Discovery rule wich check entire network
3.1) Select Name
3.2) Discovere by proxy - dpeends where and how
3.3) Select IP range
3.4) Update Internval - how often it will be scanned
3.5) Checks Type
- Ping
- HTTP
- Zabbix Agent
- SSH
3.6) Device uniquenenes select IP address
3.7) Type of info
3.8)  what you want to do
3.9) Save Discovery

4) GO To Configuration -> Action
4.1) On top of Action bar select "Discovery Actions"
4.2) Create Action
4.3) Select Name
4.4) Coditions Discovery Check
*Add all Checks you want to have
4.5) Select Operations and select operation type
4.6) Select to add host ot the group -> Unknow
4.7) Add Action


5) Go to Moniotoring -> Discovery which will display unknow devices in network.
Zabbix – Templates and Discovery – Planning of Monnitoring
Zabbix Analytics and Graphs
#View Grapsh of Latest Data on specific item

Monitoring -> Latest Data -> Select Name -> Graph
*You can there change view mode
How to create Graphs
#1 Configuration -> Hosts -> Select Host
#2 On selected Host -> Choose Graph -> Create Graphs
#3 * Please select item which will be displayed and how
#4 You can have multiple Analytics Graphs view
Maps – Topology diagrams for network, display in view mode the devices
#Nice to display Router and switches and uptimes and show them in real time, errors,
#warnings etc

#1 Go To Monitoring -> Maps -> Create Map
#* you might ave multiple maps but please go to All maps (top bar)
#2 Craete Map with mupile informations

#* You can add elemnt which has different type and then you can link them, like switches
#* with interfaces
Grafana – For more visual effects
#install Grafana

#1 install depends on OS https://grafana.com/grafana/download?src=grafana_plugin_list
#2 wget and install
#3 run service
sudo systemctl start grafana-server

#cenos firewall
sudo firewall-cmd --zone=public --permanent --add-port=3000/tcp
sudo fiewall-cmd --reaload

#4 Open Web interface [IP]:3000
#5 Login using admin / admin
* It will ask you for pre-set new password
#6 Go to Configuration -> Plugins -> install zabbix plugin for grafana
* install plugin from command line
* restart grafana servver
#6 Enable zabbix on Grafana
#7 Go to Configuration -> Add Data source and add zabbix
#8 Create new zabbix server user from where we will pull data on Grafana
#9 fill in data source and Save&Test connection
Grafana – Create View
#1 Go to Explore -> Select Zabbix and Host and yo uwill abe to see the metric of an item
#2 Base on that create Dasbhoard -> Add New Panel
* Select the Query methods
** Save Dashboard
Zabbix – Screen → How to create mutiple Grapsh on Dashboard
You can create Widget of multiple type.
Zabbix Monitor devices, Hosts, network devices
Zabbix Monitoring Linux
Zabbix Monitoring Windows
https://www.zabbix.com/integrations/windows
Zabbix Monitoring Services
Apache


Nginx


Postfix


Exim


Firewall


mail quee
Zabbix Agent less
1) Go to Confiugration Templates
2) Create TEmplate which will check ICMP (PING)
3) Create new item in new Template
4) Configuraiton of such item
Name : (HOSTNAME) - Failed Ping Check
Type: Simple check
Key: icmpping
Update interval: 3m
New Application: Availbility
Add
5) Add new trigger for that item
Trigger confiugration:
Name: (HOSTNAME) - Failed ping check
Expression: condition
	- Select item
  - function max()
   - LAST of (T) 540
   - Result = 0
Add

6) Save all and add it for example the website,
Security and Advance Administration of Zabbix
Backups
#copy content of the /etc/zabbix
rsync  -arvP /etc/zabbix mikurs:/storage/backups/zabbix

#backup mysql
mymysqldump -u root -p  -h localhost  zabbix  | pv   > zabbix_bc.sql
*you need to have install pv


#import
mysql -u root -p [newdatabase of zabbix] < backups.sql
Cluster of Zabbix
1) Raid 1 or 10
2) Virtualzation
3) Use Hyper V (windows) or pacemaker pcs (Linux)
Torn Monitoring
1) Use VPN between locatization
2) Use Proxy
3) Ports - firewall
Worst practise
1) Remove triggers which are often show
2) NOT Archive grapsh, data sets etc
3) Use Akncowledge and assing to resolve the issue - not often used.
4) Not solving the problem
5) Extending time (SLA)
Optimize Zabbix Server
Use SSD

Mysql
- use SSD
- Database on separate hardware
- Use cluster
- Using new and stable database engines
- Separate tables of database on separate drives

#if there is only database base use maximum
innoodb_buffer_pool_size = 1024M
#threads open for reading and writing
innodb_buffer_pool_instances = 8

innoodb_log_file_size = 256M
innodb_old_blocks_time = 1000
innodb_io_capacity =  [speed capacity of your drive]
sync_binlog = 0
query_cache_size = 0
query_cache_type = 0
